Modeling Reporting Delays With a Data-Lag Ladder to Prevent False CPA Spikes
Jamie
Why daily CPA pacing overreacts to “missing” conversions
Daily budget pacing tools assume today’s spend and today’s outcomes belong to the same day. In real marketing data, that’s rarely true. Clicks arrive instantly, but conversions may show up hours or days later depending on the source. When the conversion side lags, your dashboards briefly show a worse CPA than reality, and automated pacing (or a stressed operator) reacts: pausing campaigns, shifting budget, or rewriting bids based on a phantom spike.
The fix is not “wait longer” or “use weekly reporting.” It’s to model delay explicitly per source, so you can estimate how incomplete today’s conversion data is and avoid reacting until the data is sufficiently mature.
What the Data-Lag Ladder is
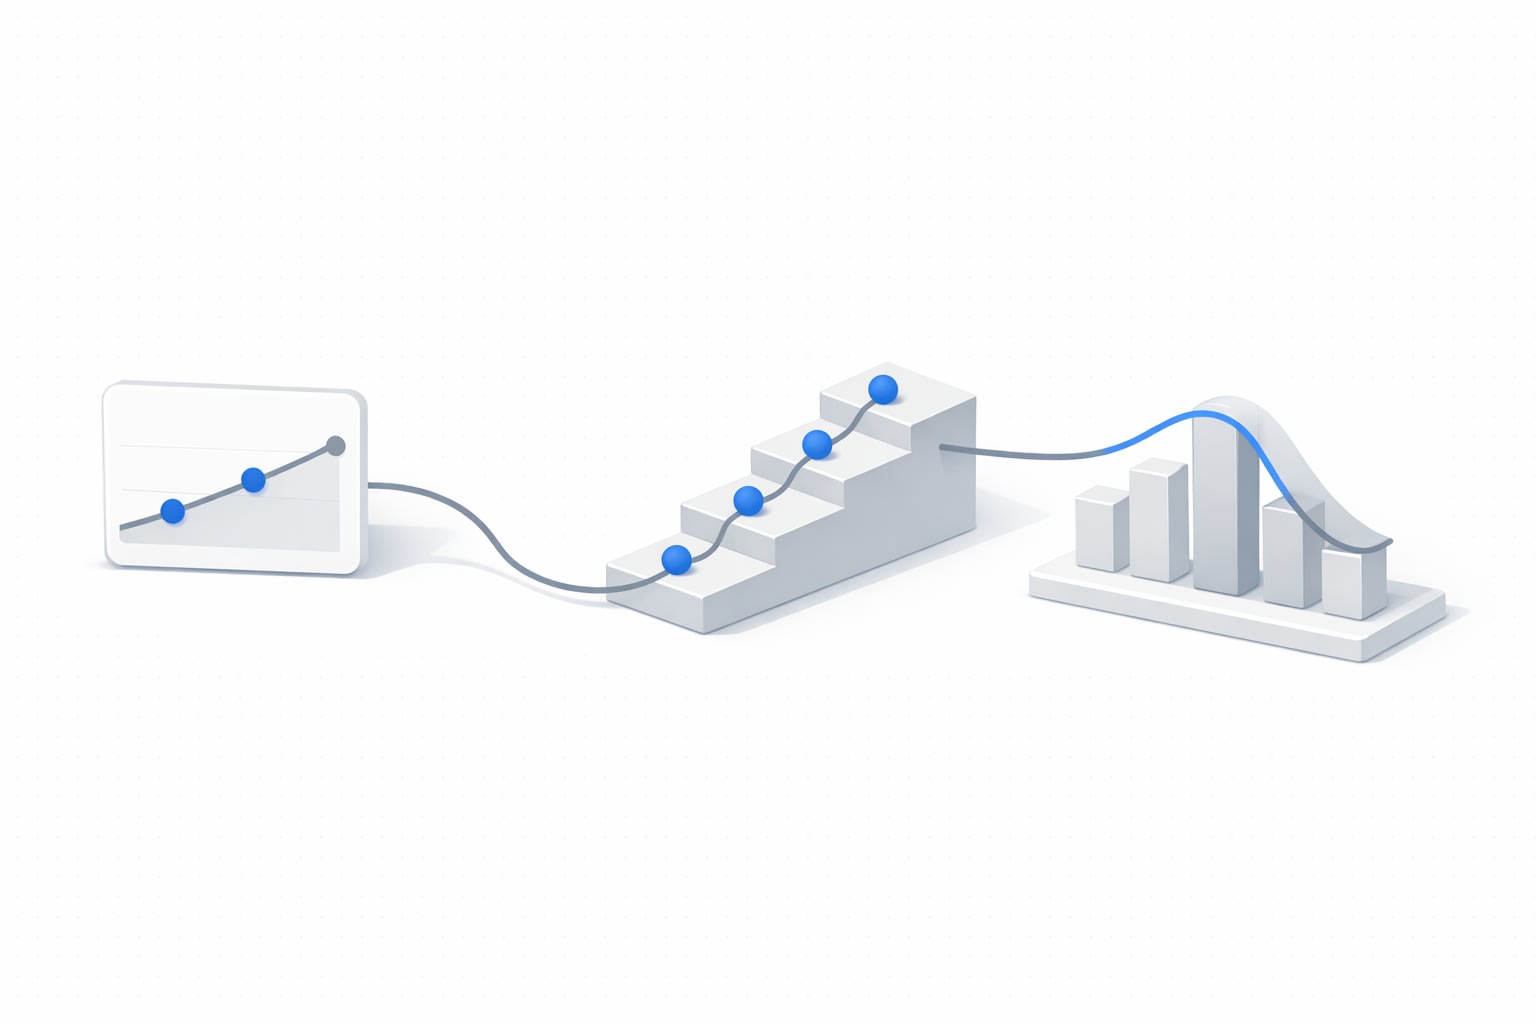
The Data-Lag Ladder is a simple model that assigns each data source a set of reporting-delay “rungs.” Each rung represents how much of the eventual conversions (or revenue) you typically have after a given amount of time has passed. The ladder lets you treat today’s performance as provisional rather than final, and it gives you a consistent rule for when a metric is safe to use for pacing decisions.
In practice, you create a lag profile per source (and sometimes per conversion type):
- Lag window: how long it takes for most outcomes to arrive (e.g., 24 hours, 72 hours, 7 days).
- Completion curve: the expected fraction of final conversions available at each delay (e.g., 0h, 6h, 24h, 48h, 72h).
- Decision thresholds: when the data is “mature enough” for pacing versus “monitor only.”
Common sources of reporting delay you should assume upfront
Reporting delay is not only about “slow tools.” It’s a product of attribution windows, postback timing, batch processing, and data stitching across systems. Typical drivers include:
- Ad platform postbacks (especially app installs and in-app events), which often arrive in batches.
- Web analytics processing time, sampling, and late events.
- CRM and offline conversion uploads (lead qualification, sales cycles, import schedules).
- Identity resolution (cross-device, cookie loss, delayed matchbacks).
One important implication: two channels can be “right” and still disagree today because they’re at different stages of completeness. If your CRM revenue is final but your ad platform conversions are lagging, you’ll see mismatches that look like tracking breaks. If you’re dealing with frequent discrepancies, it’s worth tightening your definitions and pipelines end-to-end; this guide on stopping revenue reporting mismatches between your CRM, ad platforms, and analytics provides a useful framework for aligning those systems.
How to build a Data-Lag Ladder step by step
1) Define what “final” means for each metric
Start by choosing a “finalization horizon” per metric and source: the point at which additional late arrivals are negligible (or at least operationally tolerable). For example, you might treat:
- Purchase conversions in web analytics as effectively final after 72 hours.
- CRM-qualified leads as final after 14 days.
- App events as final after 7 days.
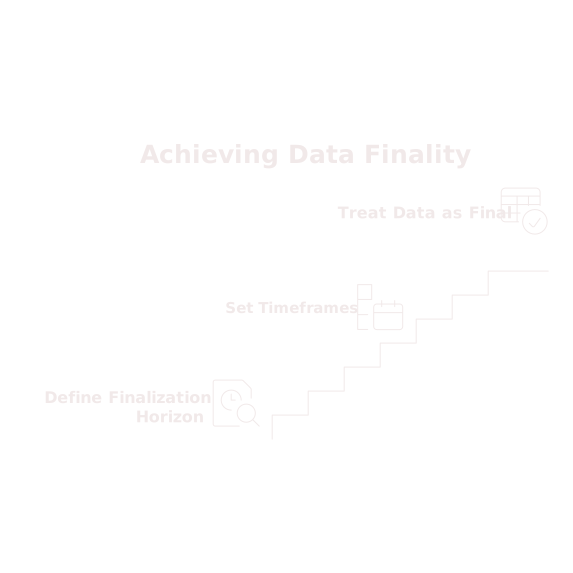
This is less about perfect truth and more about a stable yardstick. Once you pick it, you can measure incompleteness relative to that horizon.
2) Measure the delay distribution (not just the average)
Averages hide the thing that causes false alarms: the long tail. Instead, compute the cumulative completion curve. A practical way to do it:
- Pick a historical period with stable tracking (e.g., the last 8–12 weeks).
- For each conversion day, record how many conversions were visible at +0h, +6h, +24h, +48h, +72h… until your finalization horizon.
- Convert those counts into completion ratios by dividing by the final count for that conversion day.
- Aggregate ratios across days (median is often better than mean) to get a typical curve per source.
The output looks like: “After 24h, Source A has 65% of eventual purchases; after 72h, it has 92%.” That curve is your ladder.
3) Create rungs that match how your team actually makes decisions
Don’t overfit with hourly rungs if nobody operates hourly. Most teams benefit from a small, readable set such as:
- Same day (0–12h): highly incomplete, monitor only.
- Next day (12–36h): directional, small adjustments allowed.
- 48–96h: mature enough for standard pacing.
- 7 days: post-mortem and learning.
Each rung should have a documented completion expectation and a permitted action scope. This single change—explicitly limiting what you can do with immature data—reduces overreactions dramatically.
4) Convert “incomplete CPA” into a maturity-adjusted estimate
Once you know the completion ratio, you can adjust the denominator. If today’s conversions are only ~60% complete for a given source at the time you check, then an observed CPA spike might just be missing 40% of conversions that typically arrive later.
A simple estimator:
- Adjusted conversions = observed conversions / completion ratio
- Adjusted CPA = spend / adjusted conversions
This doesn’t change the underlying raw data; it gives you a better pacing signal until the data matures. It’s also a transparent model: when someone asks “why are we not pausing?”, the answer is “because this source is historically 40% incomplete at this rung.”
5) Put guardrails on automation and alerts
False spikes are often created by alerting logic that ignores data maturity. A strong pattern is:
- Alerts trigger on adjusted CPA for immature rungs.
- Alerts trigger on raw CPA only once the rung passes your maturity threshold.
- Automation (budget cuts, bid changes, pausing) is disabled or constrained before maturity.
You can also add “cooldown” logic: require the condition to hold for two consecutive mature checks before taking irreversible actions.
Operationalizing the ladder across messy multi-source reporting
The ladder becomes most valuable when you have many connectors, naming conventions, and metric definitions drifting over time. If one platform backfills conversions and another doesn’t, you need consistent, versioned transformations so that maturity rules apply to stable fields, not one-off exports.
This is where a marketing data infrastructure layer helps. With Funnel.io, teams can centralize collection across ad platforms, analytics, and CRM tools, normalize naming and currencies, and deliver an analysis-ready dataset to a warehouse, dashboard, or spreadsheet. That makes it much easier to maintain source-specific maturity curves and apply them consistently—without rewriting the logic in every report.
What changes when you adopt a Data-Lag Ladder
- Daily pacing becomes calmer: fewer reactive pauses driven by incomplete conversion data.
- Better stakeholder trust: you can explain “today is preliminary” with quantified expectations, not hand-waving.
- Cleaner experiments: you stop declaring winners based on partial outcomes.
- Faster debugging: when CPA moves, you can separate “real performance shift” from “data arrival shift.”