Feedback Exposure Index to Balance Loud Channels in Your Product Roadmap
Jamie

Why roadmaps get biased toward the loudest channels
Most product teams don’t ignore customers on purpose. The bias usually comes from where feedback is most visible. A single Slack thread from Sales, a handful of vocal power users on a community forum, or a loud comment chain in support can create the feeling that “everyone” wants the same thing.
The problem is exposure, not intent. Different channels have different volumes, different audiences, and different incentives. Support tickets skew toward break/fix urgency. Sales calls skew toward deal risk and short-term revenue. Public portals skew toward engaged users who like to participate. If your roadmap is mostly fed by the channels you hear most often, you end up overweight on “loud” feedback and underweight on “quiet” but high-impact segments.
The Feedback Exposure Index is a simple method to quantify that bias, detect when it’s happening, and then rebalance using portal data plus CRM context so your prioritization reflects real demand and real business impact.
What the Feedback Exposure Index measures
The Feedback Exposure Index (FEI) compares how much attention a channel receives inside your decision process versus how much signal it should reasonably contribute.
At a practical level, FEI answers: “Are we building for what we repeatedly see, or for what our customer base actually needs?”
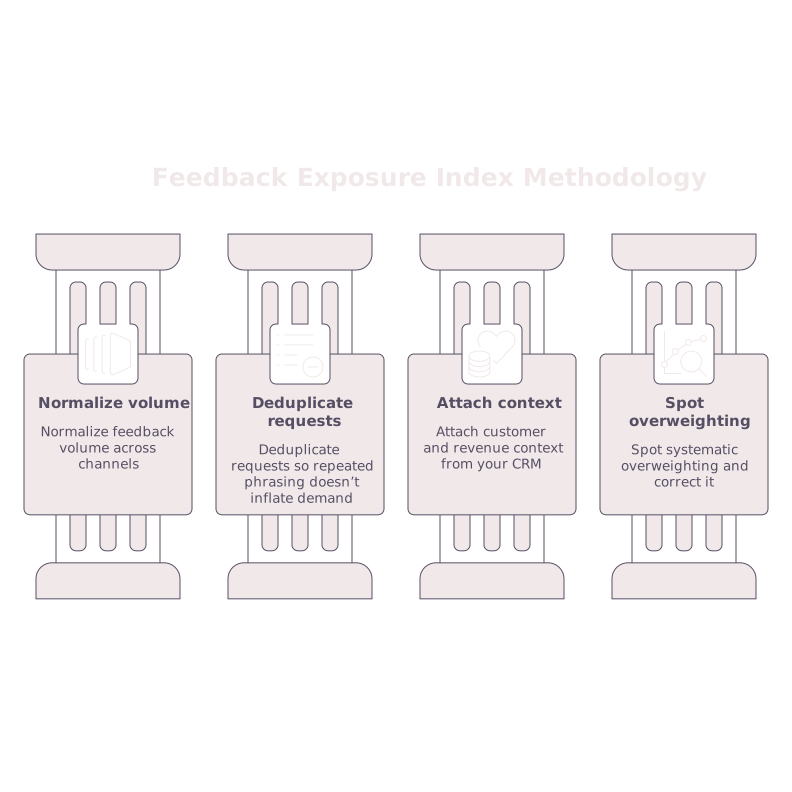
You don’t need a perfect statistical model to get value. You need a consistent way to:
- Normalize feedback volume across channels
- Deduplicate requests so repeated phrasing doesn’t inflate demand
- Attach customer and revenue context from your CRM
- Spot systematic overweighting (and correct it)
Step 1: Define channels and standardize what counts as “feedback”
Start by listing the channels that currently influence roadmap decisions. Common ones include:
- Public feedback portal (ideas, votes, comments)
- Support tickets (Zendesk/Freshdesk), helpdesk tags
- Sales transcripts and notes (Gong/Zoom), deal blockers
- Account management QBR notes
- Community forums and social mentions
- Internal Slack/Teams messages (when they represent a customer request)
Then choose a time window that reflects your planning cadence (often 60–90 days). For each channel, capture a consistent unit: a request, a ticket category, an idea, a transcript snippet, or a tagged note. The key is to avoid mixing “mentions” with “distinct requests” without labeling them.
Step 2: Deduplicate into canonical requests
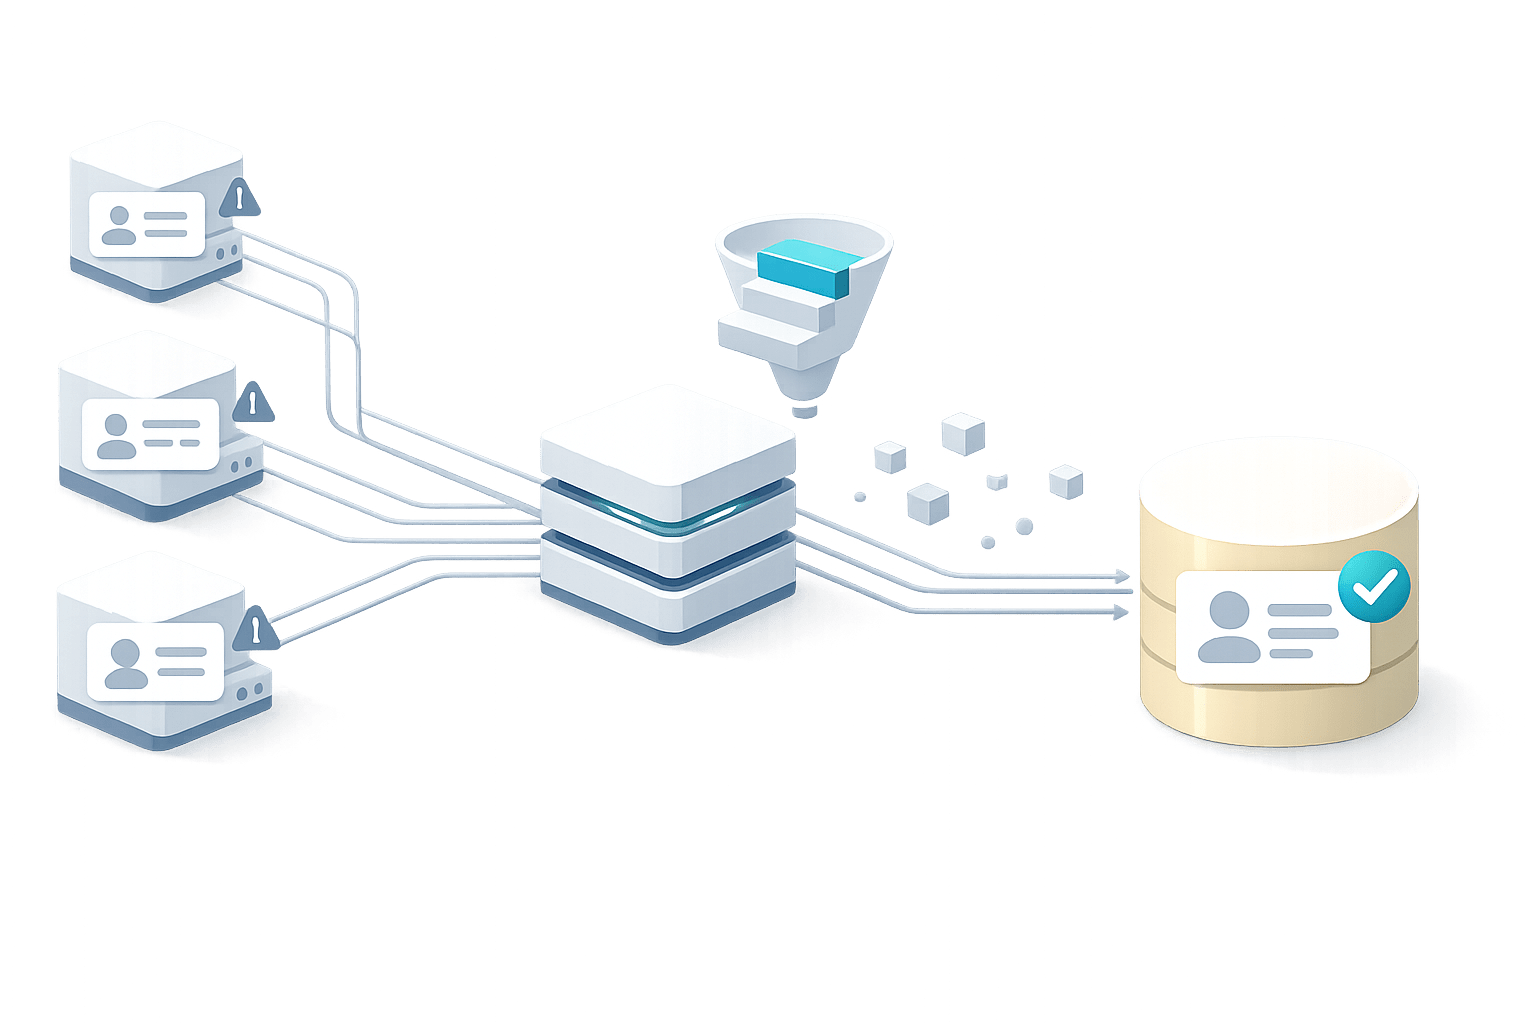
Loud-channel bias is amplified by duplicates. Ten near-identical tickets can look like ten separate problems when they’re really one request with ten instances.
Create canonical “request clusters” and map each incoming item to one cluster. If you already track feedback in canny.io, clustering is the natural center of gravity: collect from your portal and internal tools, then merge duplicates so counts represent demand instead of noise.
If you’re seeing the same request across teams but under different wording, it’s a sign you’re accumulating feedback debt. A useful companion approach is to actively look for duplicates across support, sales, and forums before you prioritize; see Feedback Debt and How to Spot Duplicate Requests Across Support Sales and Forums.
Step 3: Add CRM exposure context to each request
Portal voting is valuable, but it’s rarely representative by itself. You need CRM data to understand the audience behind each request:
- Segment: plan tier, industry, company size
- Revenue context: ARR, expansion potential, churn risk
- Lifecycle stage: trial, new customer, mature account
- Deal stage (for sales-sourced items): pipeline amount, close probability
Attach these fields at the account level (and, where possible, at the contact level). The goal isn’t to “only build for big accounts.” It’s to make the tradeoffs explicit: a request with modest volume might affect a high-revenue segment or unblock adoption.
If your CRM, ad platforms, and analytics disagree on revenue attribution, fix that first or your weighting will be unstable. This article is a good reference: Stop Revenue Reporting Mismatches Between Your CRM Ad Platforms and Analytics.
Step 4: Calculate the Feedback Exposure Index
FEI works best when it’s simple enough to run monthly. Here’s a practical version you can implement in a spreadsheet or warehouse.
4.1 Compute “attention share” per channel
Attention share is how much each channel shows up in what you discuss and prioritize. A pragmatic proxy is the share of items that make it into your “considered” set (e.g., the top N requests reviewed in planning) or the share of roadmap candidates sourced from each channel.
- AttentionShare(channel) = considered_items_from_channel / total_considered_items
4.2 Compute “signal share” per channel
Signal share estimates how much each channel should contribute after normalization. One workable method is to use deduplicated request clusters and weight them by impacted accounts and revenue context.
- Signal(channel) = sum over clusters sourced from channel of (impacted_accounts_weighted)
- SignalShare(channel) = Signal(channel) / sum(Signal(all channels))
Impacted accounts can be a weighted count such as: 1 for each impacted account, multiplied by a segment factor (e.g., enterprise vs SMB), optionally multiplied by ARR bands. Keep it consistent and auditable.
4.3 FEI ratio
- FEI(channel) = AttentionShare(channel) / SignalShare(channel)
Interpretation:
- FEI > 1: the channel is overweight in decisions relative to normalized signal (a “loud channel” effect).
- FEI < 1: the channel is underrepresented; you’re likely missing quieter demand.
Step 5: Diagnose why a channel is loud
When a channel’s FEI is high, avoid assuming the feedback is “wrong.” Instead, diagnose the mechanism:
- Visibility bias: sales/support items are discussed daily; portal items are reviewed only during planning.
- Urgency bias: outage-like pain drives immediate escalation even if it’s narrow in scope.
- Duplication bias: many near-identical tickets inflate perceived demand.
- Relationship bias: a small number of influential accounts dominate conversation.
These biases are normal. FEI just makes them measurable so you can correct for them deliberately.
How to rebalance with portal plus CRM data
Once you see the imbalance, rebalance your workflow—not just the numbers.
Make the portal the canonical request registry
Use your portal as the system of record for “what the request is,” and let internal channels feed into it. When support or sales raises something, it should map to an existing request cluster (or create a new one) rather than living as an isolated thread. This is where a centralized tool like Canny helps: it keeps the request definition stable while still capturing multi-channel input.
Run planning off weighted demand views
In your planning doc, show each candidate initiative with:
- Deduplicated demand count
- Impacted segments
- ARR/churn exposure
- Channel mix (portal vs support vs sales)
This makes it harder for a loud channel to override the rest of the dataset without an explicit decision.
Set a “quiet signal quota” for discovery
If your FEI shows underrepresentation, it often means you aren’t sampling customers evenly. Add a lightweight quota: each cycle, commit to a fixed number of interviews or reviews sourced from underrepresented segments (for example, self-serve SMBs who never open tickets).
What FEI changes in day-to-day practice
FEI isn’t a one-time audit. Used continuously, it becomes an early warning system. When your roadmap starts drifting toward a single channel, you’ll see it before the product strategy bends around the loudest room. It also gives you a calmer internal language: instead of arguing about whose input “matters,” you can show how each channel is currently influencing decisions and whether that matches the customer and revenue reality in your CRM.
The outcome isn’t a perfectly “democratic” roadmap. It’s a roadmap that’s defensible: grounded in deduplicated demand, anchored in real account context, and resilient to the natural loudness of day-to-day operations.