Measuring Incremental Lift From Product Hunt and Indie Hackers Launches Without Cookies
Jamie

Measure incremental lift without cookies
Product Hunt and Indie Hackers launches create noisy spikes: some visitors would have found you anyway, some arrive from screenshots and reposts, and many won’t carry clean attribution because modern browsers strip or truncate tracking signals. You can still measure incremental lift without cookies by combining three ingredients: referrer normalization, disciplined UTM hygiene, and first‑party events that you control end to end.
This framework is designed for privacy‑first setups where you don’t rely on persistent identifiers. It fits naturally with tools like plausible.io, which report in aggregate, avoid cookies, and still let you analyze campaigns and conversions with lightweight instrumentation.
Define what “incremental lift” means for a launch
Incremental lift is the difference between what happened during your launch window and what would have happened without the launch. For Product Hunt and Indie Hackers, that’s rarely “more pageviews.” The lift you actually want is usually one of these:
- Activation lift: more users reaching an “aha” moment (e.g., created project, imported data, completed onboarding).
- Signup lift: more qualified signups (not just email captures).
- Revenue lift: more trials that convert, or more paid upgrades.
Choose one primary conversion and one secondary “leading indicator” (for example, signup as primary, onboarding completion as secondary). You’ll use both to avoid overvaluing low‑intent traffic.
Normalize referrers to reduce attribution chaos
Launch traffic fragments across many referrer strings. You’ll see variations like “producthunt.com,” “www.producthunt.com,” “m.producthunt.com,” or visits where the referrer is missing because someone copied a link into Slack, iMessage, or an email client. Indie Hackers has similar issues, plus reposts on forums and newsletters.
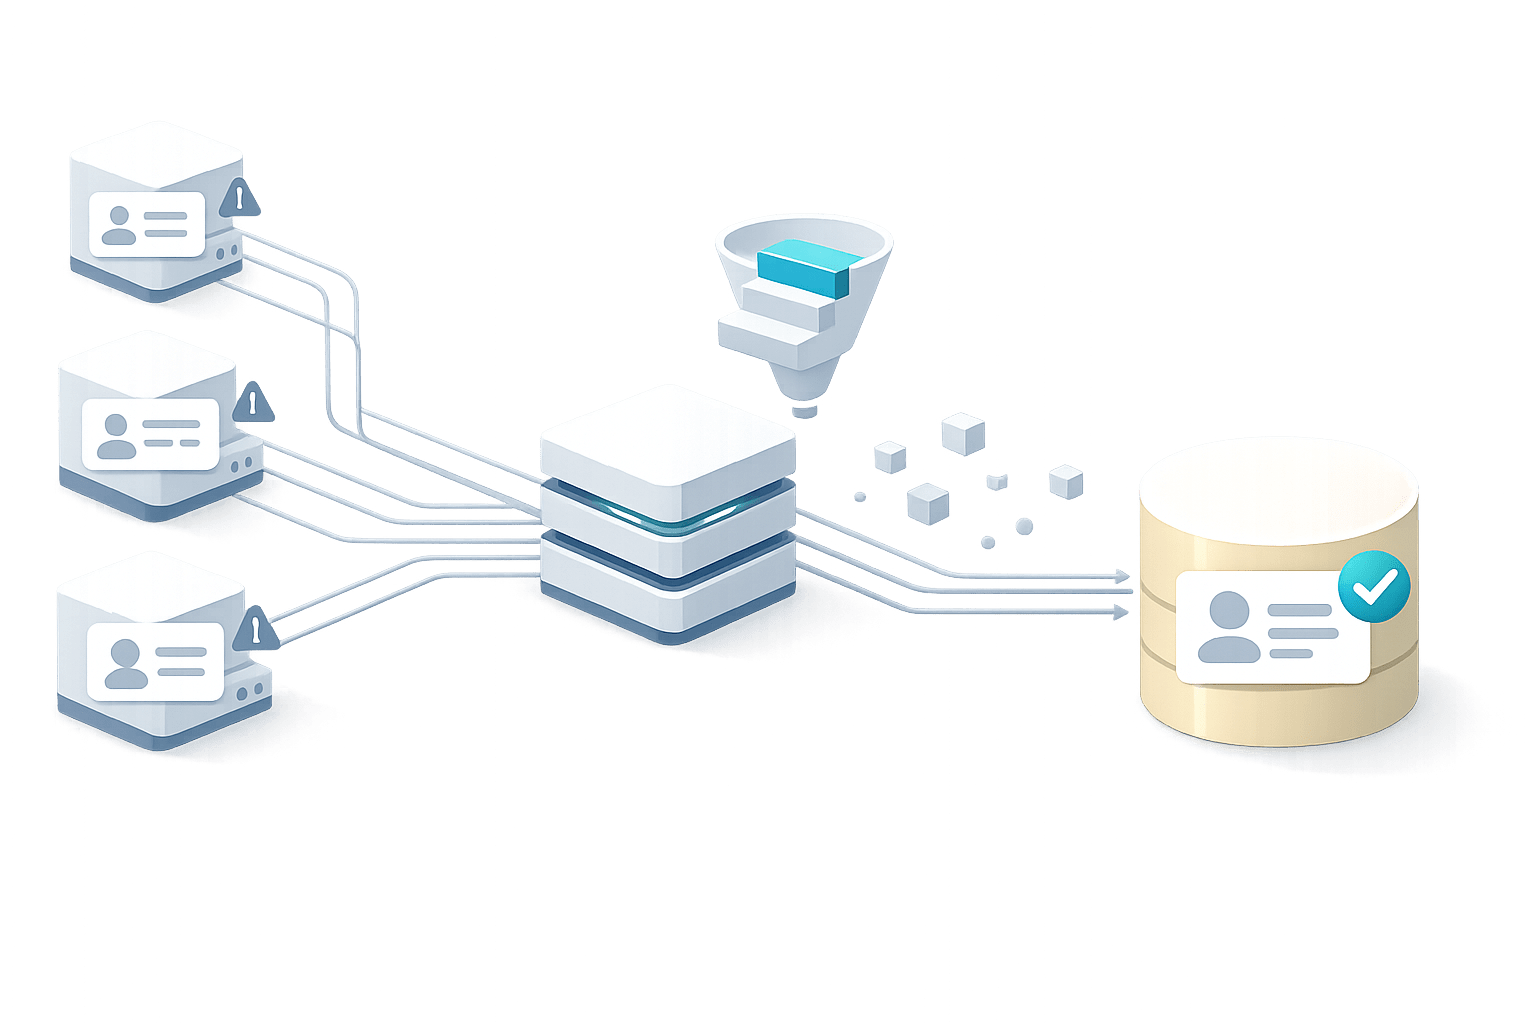
Referrer normalization is the step where you map messy inputs into a small set of stable sources. Do it as a data layer rule, not as a one‑off spreadsheet fix.
Build a referrer normalization table
Create a mapping table that collapses common variants into canonical buckets:
- Product Hunt: producthunt.com, www.producthunt.com, m.producthunt.com
- Indie Hackers: indiehackers.com, www.indiehackers.com
- Launch reposts: known newsletters or communities you expect (e.g., “Hacker News” if you’re also posting there)
- Dark social: no referrer + landing page contains launch UTM or a launch path
The goal isn’t perfection; it’s consistency. Once your normalization is stable, you can compare launches across months and avoid the “this looks different because the strings changed” trap.
Use UTMs as a contract, not a suggestion
UTMs still matter in a cookieless world because they travel with the URL. They’re your strongest link between a post and an outcome, especially when referrers drop.
Minimal UTM schema for launches
Keep it simple enough that you’ll actually use it:
- utm_source: producthunt or indiehackers
- utm_medium: launch
- utm_campaign: a date or launch name you’ll reuse everywhere (e.g., 2026-07-ph-launch)
- utm_content (optional): distinguish placements (topbar, comment, profile, reply)
Two practical rules prevent most reporting headaches:
- Never mix casing (ProductHunt vs producthunt). Decide once, enforce forever.
- Always link to the same canonical landing page for a given launch message, then branch variations via utm_content.
If you use multiple landing pages, you’ll end up measuring page differences instead of channel lift.
Instrument first‑party events that represent real intent
Pageviews spike on launch day. Intent doesn’t always follow. First‑party events let you measure actions that correlate with value while staying privacy‑preserving.
Pick 3–5 launch events
Choose events that are (1) observable on your site or app, (2) hard to fake accidentally, and (3) close to value:
- Signup (account created)
- Onboarding complete (finished key steps)
- Key action (created first project, sent first invite, imported first dataset)
- Upgrade (started trial, subscribed, or reached checkout success)
With a privacy‑first analytics stack, these can be tracked as custom events without tying them to a persistent user profile. What matters is the aggregate relationship between campaign/referrer buckets and event counts.
Design the measurement window and baseline
Launch effects are time‑boxed but not instantaneous. Define windows up front so you don’t move the goalposts after seeing the numbers.
Recommended windows
- Primary window: launch day to +2 days (captures the spike and immediate curiosity)
- Secondary window: launch day to +14 days (captures delayed trials and weekday/weekend effects)
For baseline, use the same days of the week immediately preceding the launch (e.g., the previous 2 weeks), then adjust for seasonality if you have enough history. If your volume is low, extend the baseline period to reduce variance.
Compute lift using a simple “expected vs observed” model
At a minimum, compute lift for each metric:
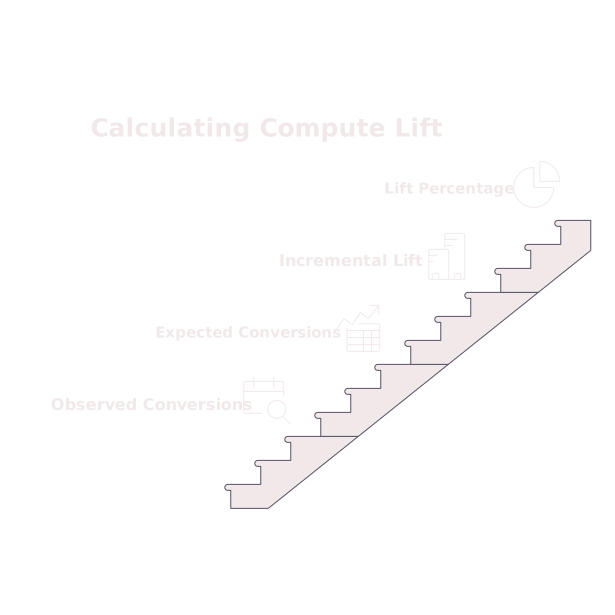
- Observed: conversions in the window
- Expected: baseline average per day × number of days in the window
- Incremental lift: observed − expected
- Lift %: (observed − expected) / expected
Then break down observed conversions by your normalized referrer buckets and UTM campaign. The split won’t be perfect, but it will be directionally consistent, and it will help you answer the real question: “Did this launch create additional conversions, and where did the quality come from?”
Handle reporting delays and attribution gaps
Launch conversions often arrive late: people visit on Product Hunt, come back via direct later, and convert days after. Even with good UTMs, some later sessions will look unattributed.
Two tactics help:
- Include a 14‑day window so you capture delayed outcomes.
- Track a leading indicator event (like onboarding complete). It usually happens closer to the click and is less vulnerable to “came back later” attribution loss.
If your paid conversions post back from billing or your CRM, mismatches can appear when systems disagree on timing and definitions. Keeping a single source of truth for revenue events and aligning timestamps reduces confusion; this is where a disciplined approach to revenue reporting mismatches across CRM, ad platforms, and analytics saves hours after every launch.
Similarly, if you routinely react to short‑term spikes (or dips) in cost per acquisition around launches, model lag explicitly so you don’t misread incomplete data. A practical approach is a data-lag ladder to prevent false CPA spikes, which is especially useful when payments and CRM events arrive later than web events.
Interpret results like an operator, not a dashboard tourist
For Product Hunt and Indie Hackers, a strong outcome often looks like:
- A clear uplift in leading indicator events tied to launch UTMs/referrers
- A smaller but measurable uplift in primary conversions within 14 days
- A post‑launch “new normal” where baseline traffic or signups stay slightly elevated
If you only get pageview lift, you didn’t necessarily fail—you may have a messaging or onboarding gap. The point of first‑party events and normalization is that you can diagnose where the funnel bent: awareness rose, intent didn’t.
A simple checklist before you launch
- Finalize UTM schema and paste-ready links for every placement.
- Verify normalized referrer buckets in your analytics view.
- Confirm 3–5 first‑party events fire correctly in staging and production.
- Lock measurement windows (0–2 days and 0–14 days) and baseline period.
- Document the primary metric and one leading indicator so the team reads the same scoreboard.
With this setup, you can measure incremental lift credibly without cookies or user-level tracking, while still learning what your launch actually changed.